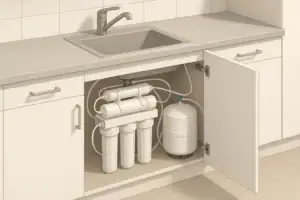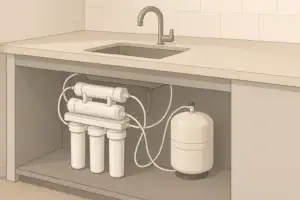
Reverse osmosis (RO) systems improve taste and reduce many dissolved solids by pushing water through a semi-permeable membrane. During this process, the membrane separates water into two streams:
- Permeate – the filtered water you drink or use for cooking
- Concentrate (often called waste or reject water) – the water that carries away rejected minerals and other dissolved substances
The RO waste water ratio describes how much concentrate is produced compared with permeate. It is usually written as:
- X : 1 – where X parts are waste (concentrate) for every 1 part filtered water (permeate)
For example, a 3:1 ratio means that for every 1 gallon of filtered water, about 3 gallons go to drain.
What Is RO Waste Water Ratio?
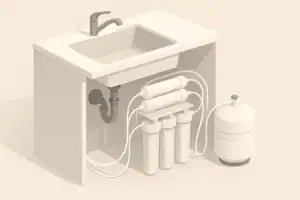
Reverse osmosis (RO) systems improve taste and reduce many dissolved solids by pushing water through a semi-permeable membrane. During this process, the membrane separates water into two streams:
- Permeate – the filtered water you drink or use for cooking
- Concentrate (often called waste or reject water) – the water that carries away rejected minerals and other dissolved substances
The RO waste water ratio describes how much concentrate is produced compared with permeate. It is usually written as:
- X : 1 – where X parts are waste (concentrate) for every 1 part filtered water (permeate)
For example, a 3:1 ratio means that for every 1 gallon of filtered water, about 3 gallons go to drain.
What’s a “Normal” RO Waste Water Ratio?
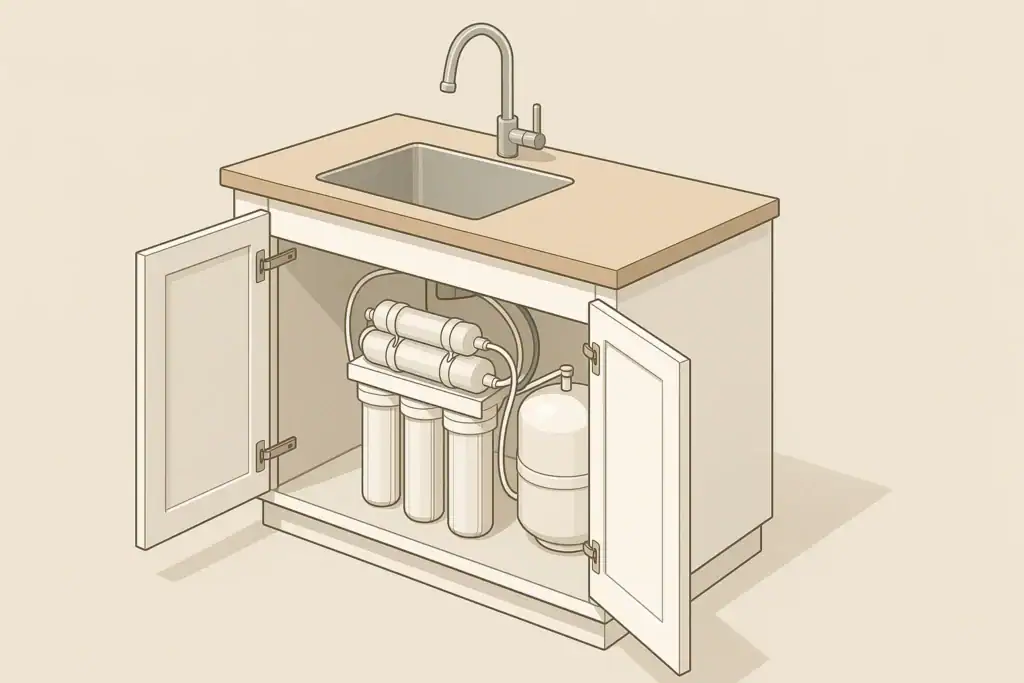
There is no single universal ratio for every household. The actual waste water ratio depends on several conditions, including your plumbing, incoming water quality, and the specific RO configuration. However, typical home under-sink RO systems in the U.S. often fall into a general range.
Typical Ranges for Home RO Systems
In many home setups, these approximate ranges are common examples:
- Traditional under-sink RO (tank type): around 3:1 to 4:1 (waste:product) in many real-world installations
- More water-efficient designs or favorable conditions: sometimes in the 2:1 range
- Unfavorable conditions (very cold water, very low pressure, or very high dissolved solids): ratios can climb higher than 4:1
These ranges are example values only. Actual performance can vary widely from home to home.
Factors That Influence RO Waste Water Ratio
Your system’s waste water ratio is mainly shaped by:
- Feed water pressure – Higher pressure generally improves efficiency and can reduce the amount of concentrate.
- Water temperature – Colder water is more viscous and passes through the membrane more slowly, often increasing waste.
- Total dissolved solids (TDS) in the source water – Higher TDS usually means more concentrate is needed to keep the membrane clean.
- Flow restrictor and plumbing design – These control how fast water can exit as concentrate and strongly affect the ratio.
- Membrane age and condition – A fouled or aging membrane can change both production rate and waste volume.
Because so many variables are involved, the best way to understand your specific waste water ratio is to measure it at home.
Example values for illustration.
| Observed waste:product ratio (example) | Typical situation | What to consider next |
|---|---|---|
| About 2:1 | Often seen with good pressure and moderate TDS | Verify water taste and flow; monitor for membrane scaling |
| About 3:1 | Common example for many under-sink RO systems | Usually acceptable; focus on regular maintenance |
| About 4:1 | May occur with cooler water or slightly lower pressure | Check pressure, prefilters, and flow restrictor sizing |
| Higher than 5:1 | Often indicates low pressure or a restriction | Inspect feed pressure, clogged filters, or partially blocked lines |
| Less than 1:1 | Very low waste volume | Confirm membrane health and TDS performance before keeping this setup |
| Ratio changes suddenly | System behavior no longer matches past performance | Look for recent plumbing changes, new filters, or flow restrictor issues |
How to Measure Your RO Waste Water Ratio at Home
You can estimate the waste water ratio with simple household tools. This helps you decide if your system is working as expected or if adjustments might be needed.
Step-by-Step Measurement Method
Use two containers of similar size, such as buckets or large pitchers.
- Turn off other water uses to avoid confusing the timing.
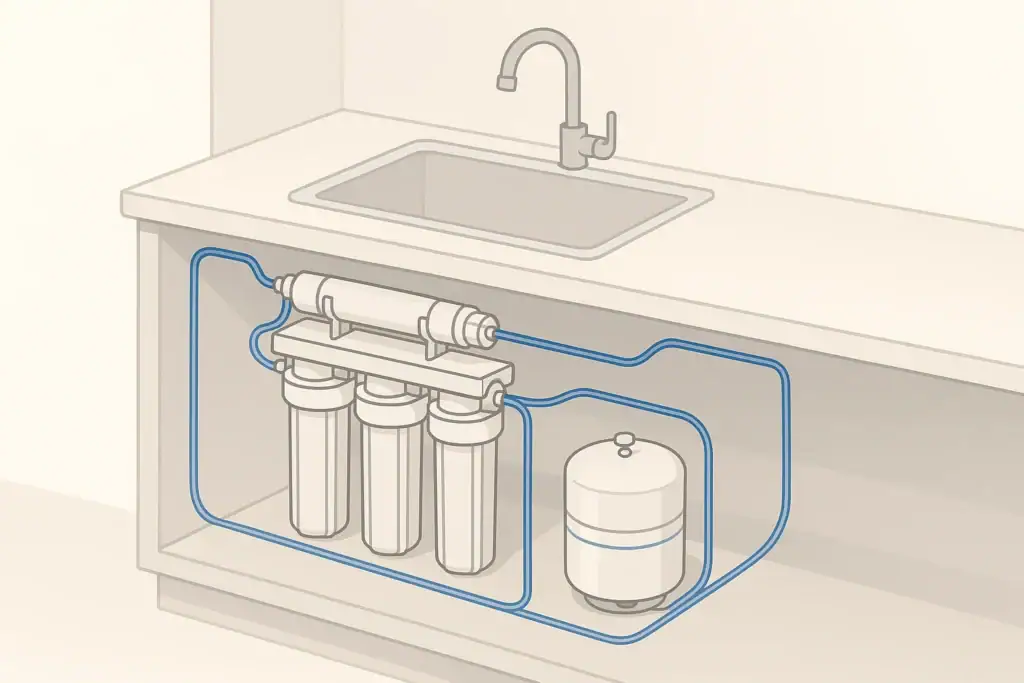
- Locate the RO waste line – the small tube that carries concentrate to the drain.
- Gently redirect the waste line into one container. Many people temporarily place the tube into a bucket near the sink or under-sink drain area.
- Open the RO faucet fully so the system is producing water at a steady rate.
- Collect both streams simultaneously:
- Filtered water from the RO faucet into container A
- Waste water from the waste line into container B
- Time the collection – for example, 10 or 15 minutes; keep it the same for both streams.
- Measure the volumes – you can use measuring jugs, markings on the buckets, or even a bathroom scale (1 pound of water is roughly 0.12 gallons as a general estimate).
- Calculate the ratio – divide the waste volume by the filtered volume.
For instance, if you collect 3 gallons of waste and 1 gallon of filtered water, your observed ratio is 3:1.
Check TDS at the Same Time
While you measure the ratio, it is useful to check total dissolved solids (TDS) if you have a basic meter:
- Test feed water from the tap
- Test RO water from the RO faucet
A lower TDS on the RO side relative to the tap usually indicates the membrane is functioning. If your waste water ratio is very low but TDS reduction is poor, your system may be too restrictive on the waste side or the membrane may need attention.
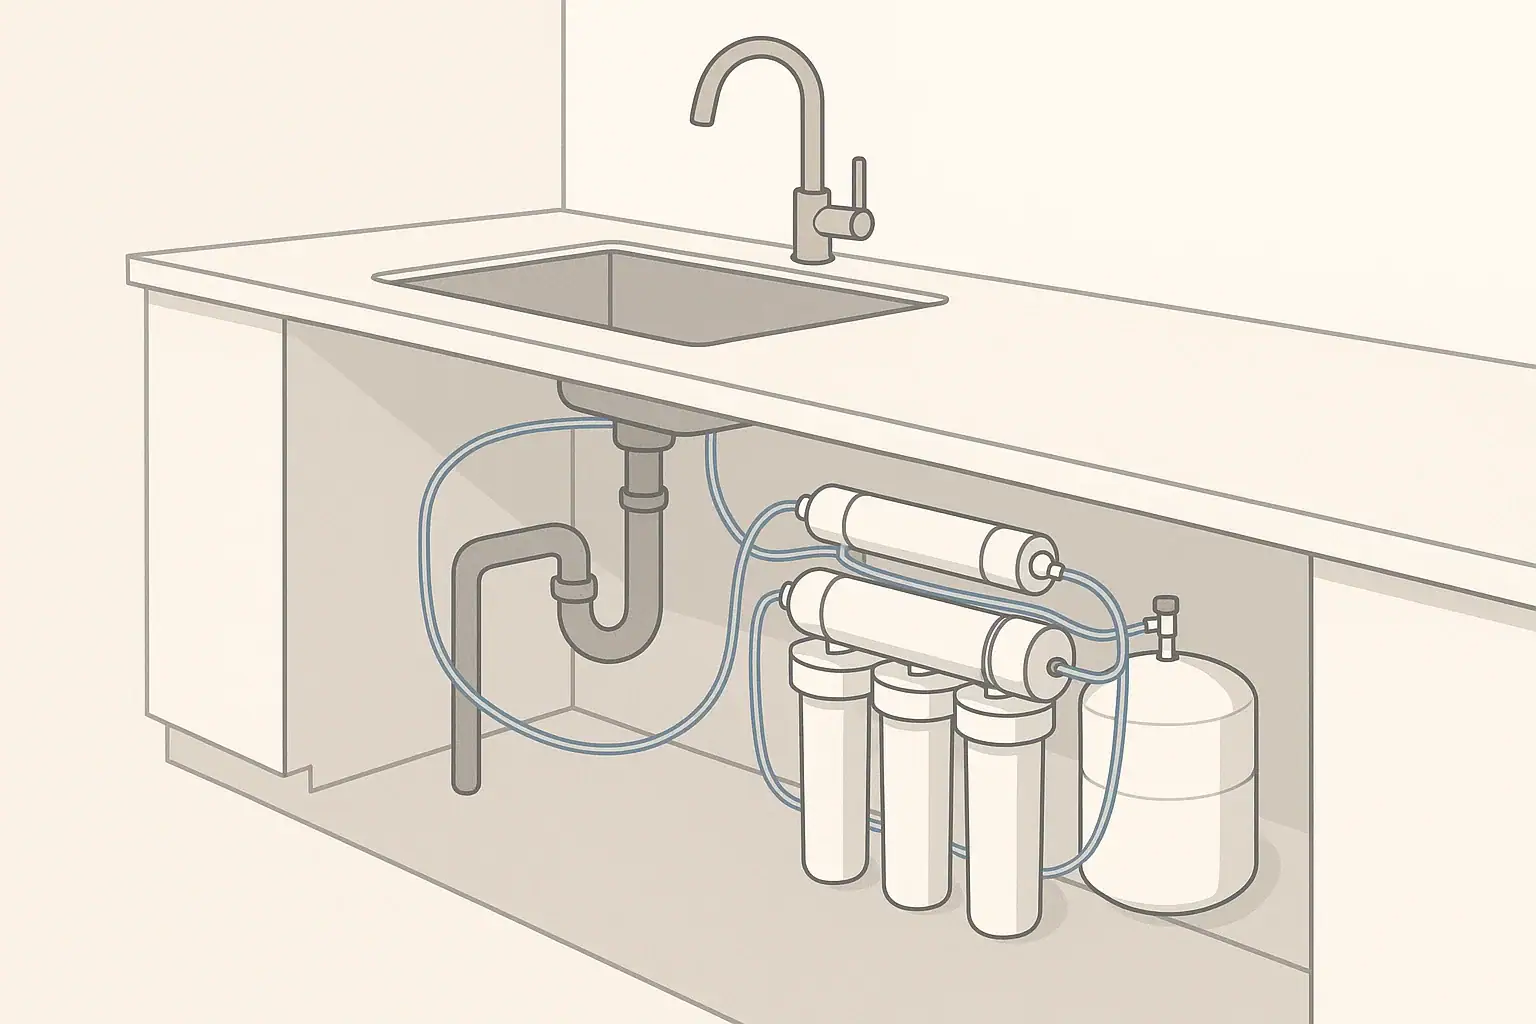
Why RO Systems Produce Waste Water
RO membranes work by having water flow across their surface under pressure. Some water passes through the membrane as permeate, while the rest remains on the “salty” side as concentrate. This cross-flow rinses away accumulated dissolved solids and helps keep the membrane from clogging quickly.
Cross-Flow Filtration and Membrane Protection
The concentrate stream is not just a byproduct; it serves an important function:
- Flushes away concentrated minerals and particles that would otherwise build up on the membrane surface.
- Reduces scaling risk from substances like calcium and magnesium when their concentration rises.
- Helps maintain consistent flow and performance over the life of the membrane.
If waste water is reduced too much without proper system design, the membrane may foul faster, permeate production may drop, and TDS reduction may worsen.
Impact of Water Quality and Pressure
Several incoming water conditions push the ratio higher or lower:
- High TDS water usually requires more wastewater to keep the membrane flushed.
- Low pressure reduces the driving force through the membrane, so more flow is diverted to waste to maintain cross-flow.
- Very cold water slows permeate production because the water is thicker and moves more slowly through the membrane.
Understanding these basics helps you choose realistic ways to reduce waste without compromising the system.
Practical Ways to Reduce RO Waste Water Safely
There are two broad approaches to reducing RO waste water:
- Improve RO efficiency so the system uses water more effectively.
- Reuse or redirect waste water for non-drinking purposes.
Any change should preserve adequate cross-flow across the membrane and maintain reasonable TDS reduction. If you experiment with adjustments, monitor both the ratio and water quality over time.
1. Optimize Feed Water Pressure
Pressure is one of the most important variables for RO efficiency.
- Check household water pressure: Many homes have pressures within a typical range, but some are significantly lower.
- Observe RO performance: Slow tank filling and a high waste ratio can be associated with low pressure.
Some systems are designed to work with a booster pump when feed pressure is on the low side. Increased pressure typically increases permeate production for the same amount of concentrate, which effectively lowers the waste ratio.
2. Maintain Prefilters and the RO Membrane
Clogged or overdue filters can reduce flow and create unfavorable ratios.
- Sediment filters can load up with rust, sand, and fine particles, restricting flow and reducing effective pressure at the membrane.
- Carbon filters protect the membrane from chlorine or chloramine, but if they clog, they can also reduce pressure.
- Old membranes may produce less permeate and alter the waste ratio.
Following the manufacturer’s suggested replacement intervals, or using clear performance cues (like noticeable flow reductions or taste changes), helps maintain a stable ratio and consistent water quality.
3. Verify the Flow Restrictor
The flow restrictor on the waste line is a small but critical component. It controls how quickly water can leave as concentrate and strongly influences the waste ratio.
- If the restrictor is too tight, you may see lower waste volume but potentially stressed membrane operation.
- If the restrictor becomes partially blocked with debris, waste flow can change and ratios may become unpredictable.
- If the restrictor is too open, you may see a high waste ratio with lower permeate output.
If your ratio is far outside typical example ranges and other factors look normal, the flow restrictor may be worth inspecting or replacing with a model suited to your membrane capacity.
4. Control Feed Water Temperature Where Practical
In many homes, incoming water temperature naturally varies by season. Extremely cold feed water can slow permeate production and increase waste.
- Some people route the RO supply from a tempered cold line (still cold, but not at the coldest point of the plumbing run), within plumbing code and safety guidelines.
- Avoid using warm or hot water as RO feed, since high temperatures can damage membranes.
You do not need to actively heat water for RO, but avoiding the very coldest possible feed can sometimes help moderate waste, depending on your plumbing layout.
5. Reuse RO Waste Water for Non-Drinking Tasks
Even if you cannot significantly move the ratio, you can still reduce how much water ultimately goes down the drain by reusing concentrate where appropriate. The concentrate typically has:
- Higher TDS than your tap, because it carries the rejected minerals
- Similar taste to tap water or slightly more mineral taste
Common household reuses include:
- Flushing toilets (where routing is practical and allowed)
- Cleaning floors or mopping
- Rinsing outdoor tools or equipment
- Initial rinse for dishes that will be washed again with regular tap water
If considering plant watering, test cautiously and observe how your plants respond, especially if your tap water has very high TDS. Some plants are more sensitive to mineral levels than others.
6. Match RO System Size to Your Actual Needs
Oversized systems or setups that produce far more water than you regularly use can have efficiency tradeoffs. On the other hand, a system that constantly runs near its limits may not maintain the best balance between production rate and waste.
- Estimate your daily RO water usage for drinking, cooking, and ice.
- Choose a system capacity and storage volume that aligns reasonably with that usage, so the system can cycle in a stable, predictable way.
Right-sizing helps you avoid unnecessary complexity while keeping waste within a reasonable range for your situation.
Balancing Efficiency, Performance, and Maintenance
Reducing RO waste water requires balance. Aggressive attempts to lower the concentrate flow without proper design can shorten membrane life, reduce flow rate, and change taste or odor. Instead, think of waste management as part of your overall water quality plan.
Track a Few Key Metrics
Keeping simple records can help you spot trends early:
- Waste water ratio – Check once or twice a year or after major changes.
- TDS readings – Occasionally measure both feed and RO water.
- Flow rate or tank fill time – Note if the RO faucet becomes noticeably slower over time.
A combination of a stable ratio, consistent TDS reduction, and predictable flow usually indicates that your RO system is operating in a healthy range.
Understand Typical Filter and Membrane Lifespans
Although exact intervals depend on your water and usage, many home RO users track replacement in terms of months or gallons as general guidance. Sticking close to the recommended pattern can prevent performance drift that leads to unexpected waste ratios.
Example values for illustration.
| Maintenance item | What to monitor | Typical cues | Planning tip |
|---|---|---|---|
| Sediment prefilter | Visible discoloration, flow restriction | Noticeably slower RO faucet flow compared with new filter | Note installation date and check every few months |
| Carbon prefilter | Chlorine/chloramine protection for membrane | Change on schedule even if flow seems normal | Replace according to suggested interval to protect membrane |
| RO membrane | TDS reduction and production rate | Rising TDS at RO faucet or long tank fill times | Record TDS readings yearly to spot gradual changes |
| Post-filter (polishing stage) | Taste and any new odors | Water tastes flat or different than usual | Replace on schedule or when taste changes |
| Flow restrictor | Waste:product ratio | Ratio drifts far from earlier measurements | Re-check ratio after any filter or membrane change |
| Storage tank | Volume of water delivered before flow slows | Tank seems to empty faster than it used to | Periodically verify tank pressure according to system guidance |
When to Consider System Changes
If you consistently see a waste water ratio that feels too high for your comfort, or if performance is not meeting your expectations, it may be time to re-evaluate your setup.
Questions to Ask Before Changing Anything
- Has my household water pressure changed?
- Is the incoming TDS higher than it used to be?
- Have I kept up with filter and membrane replacement?
- Did I recently replace any components, such as the flow restrictor or storage tank?
Addressing these points often restores a reasonable waste water ratio. If you still want to reduce waste further, you can then look into system designs that emphasize higher water efficiency, as long as they remain compatible with your water conditions and maintenance habits.
Ultimately, a “normal” RO waste water ratio is the one that provides consistent taste, odor, and flow while using water responsibly for your home’s specific conditions.
Frequently asked questions
How often should I measure my RO waste water ratio?
Measure the ratio once or twice a year and any time you notice performance changes (slower faucet flow, different taste, or a recent filter or membrane change). Also check after plumbing changes or if feed water pressure or temperature shifts significantly.
Can I reduce the RO waste water ratio by adjusting or replacing the flow restrictor?
Changing the flow restrictor will affect the ratio, but making it too restrictive can reduce cross-flow and harm membrane performance, increasing TDS at the faucet. If you suspect the restrictor is wrong or blocked, inspect and replace it with the correctly sized part for your membrane rather than arbitrarily tightening it.
Is it safe to reuse RO concentrate for watering plants?
Reusing concentrate for non-edible plants or outdoor tasks can reduce overall water waste, but check the concentrate TDS first. Some plants are sensitive to high mineral levels, so start by diluting the concentrate, testing on a small number of plants, and observing their response before wider use.
Will installing a booster pump lower my RO waste water ratio?
Yes—raising feed pressure with a booster pump usually increases permeate production for the same waste flow, effectively lowering the waste:product ratio. Ensure your RO components are rated for higher pressure and consider pump cost, noise, and installation before adding one.
What waste:product ratio or signs indicate I should replace the RO membrane?
Rather than a single ratio threshold, look for combined signs: steadily rising TDS at the RO faucet, much longer tank fill times, and a ratio that drifts suddenly from your baseline. If TDS reduction worsens or performance changes despite normal pressure and clean prefilters, the membrane is likely due for replacement.
Recommended next:
- NSF/ANSI standards explained (42/53/401/58)
- Clear trade-offs: pitcher vs faucet vs under-sink vs RO
- Maintenance planning: cost per gallon and replacement cadence