
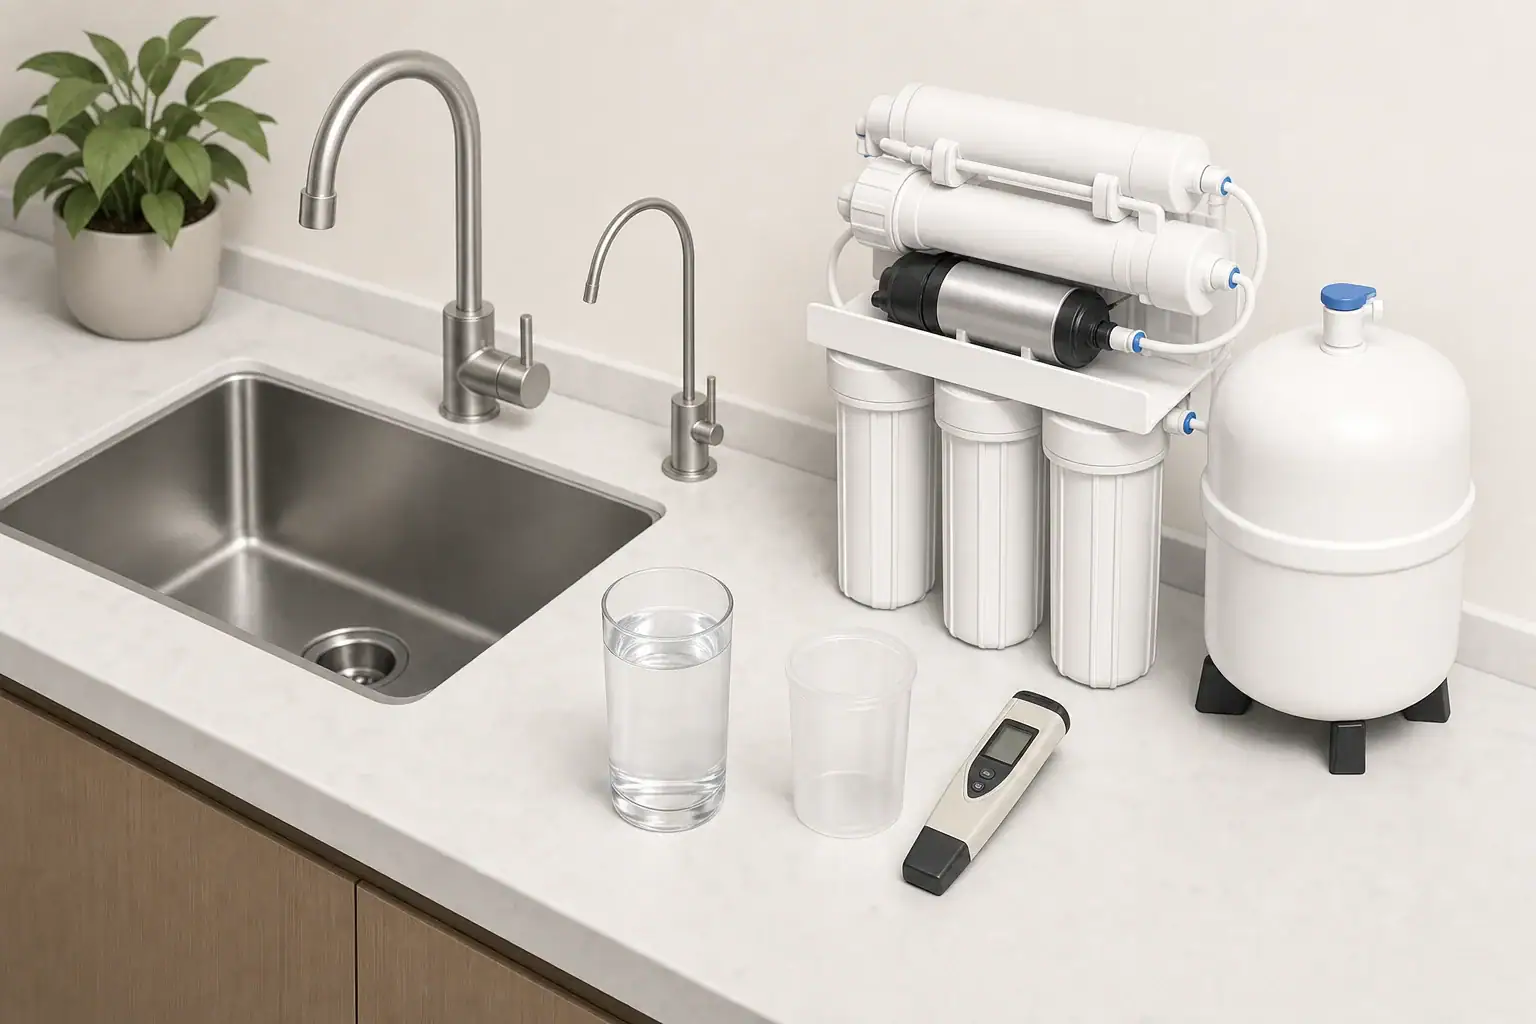
RO membrane rejection rate is the percentage of dissolved material the membrane keeps out of its product water. It is commonly estimated by comparing the total dissolved solids (TDS) or conductivity of the water entering the membrane with that of the water leaving it.
The basic calculation is:
Rejection rate (%) = [(feed-water TDS − product-water TDS) ÷ feed-water TDS] × 100
For example, if the feed water measures 300 parts per million (ppm) TDS and the product water measures 12 ppm, the estimated rejection rate is 96%:
[(300 − 12) ÷ 300] × 100 = 96%
This percentage is useful for tracking membrane performance, but it is not a direct measurement of every contaminant. Accurate interpretation depends on where and when the samples are collected, the membrane’s rated performance, and operating conditions such as pressure and temperature.
What the Rejection Rate Measures
A reverse osmosis membrane separates incoming water into two streams:
- Permeate or product water: Water that passes through the membrane and moves toward the storage tank or faucet.
- Concentrate or drain water: Water that carries rejected dissolved material to the drain.
The rejection rate compares the dissolved-ion concentration in the feed water with the concentration in the permeate. A higher percentage generally means the membrane is allowing fewer dissolved ions through.
Rejection rate is different from recovery rate. Rejection describes dissolved-solids reduction, while recovery describes how much feed water becomes product water. A system can have high salt rejection and still send a substantial portion of its incoming water to the drain.
How to Calculate RO Membrane Rejection Rate
1. Identify the correct sampling points
The feed sample should represent water entering the RO membrane. The product sample should come from the membrane’s permeate stream before any remineralization cartridge, intentional blending valve, or other stage that adds dissolved minerals.
A sample from the drinking-water faucet may have passed through a storage tank, post-filter, or remineralization stage. That reading can help track overall system output, but it may not isolate membrane performance.
Use accessible sampling points and follow the system manufacturer’s procedures. Do not open a pressurized membrane housing or disconnect tubing while the system is operating.
2. Let the system operate normally
RO product water can show temporarily elevated TDS after the system has been idle. This is sometimes called TDS creep. Allowing the system to run or begin a fresh production cycle can provide a more representative sample.
If the membrane is new, follow the specified flushing procedure before evaluating it. Preservatives and manufacturing residues can affect early readings.
3. Measure feed and product water consistently
Use the same clean meter for both samples. Rinse the probe and sampling container with the water being tested before taking each reading. Testing the samples at similar temperatures reduces measurement variation, even when the meter includes automatic temperature compensation.
Most handheld TDS meters actually measure electrical conductivity and convert it to an estimated TDS value. Conversion methods vary among meters, so comparisons are most useful when made with the same device.
4. Apply the formula
Subtract the product-water TDS from the feed-water TDS. Divide the difference by the feed-water TDS, then multiply by 100.
As another illustrative example, feed water at 500 ppm and product water at 25 ppm produce an estimated rejection rate of 95%:
[(500 − 25) ÷ 500] × 100 = 95%
How to Interpret the Result
There is no single rejection percentage that applies to every membrane and every installation. Many residential thin-film composite membranes have nominal salt-rejection ratings in the upper 90% range, but the relevant benchmark is the membrane’s own specification under its stated test conditions.
Those laboratory rating conditions may specify feed pressure, water temperature, pH, dissolved-solids concentration, and recovery. Household conditions rarely match them exactly, so an installed membrane may not reproduce the nominal value precisely.
Use three reference points when interpreting a reading:
- The membrane specification: Compare the result with the rated rejection and the conditions used to establish it.
- A stable baseline: Record performance after a new membrane has been properly flushed and has settled into normal operation.
- The trend over time: A repeated decline under similar conditions is more informative than one unusual reading.
A small change does not automatically indicate membrane failure. Meter accuracy, sample temperature, recent system use, tank pressure, and feed-water variation can all move the result. A persistent drop of several percentage points from an established baseline deserves investigation, especially if product-water TDS continues to rise.
Why low-feed TDS complicates the calculation
Percentage calculations become sensitive to small measurement errors when feed-water TDS is low. For example, a change of only 1 ppm in product water has a much larger effect when the feed is 25 ppm than when it is 500 ppm.
If feed water measures 25 ppm and product water measures 2 ppm, the calculated rejection is 92%. If the product reading shifts to 3 ppm because of meter resolution or sampling variation, the result falls to 88%. Multiple measurements are especially important under these conditions.
What negative or impossible results mean
If product-water TDS is equal to or higher than feed-water TDS, first check the sampling method rather than assuming the membrane has negative rejection. Common explanations include reversed samples, testing after a remineralization stage, residue in a cup, an uncalibrated meter, or a stagnant sample affected by TDS creep.
Reasons an RO Rejection Rate May Be Low
Sampling after mineral addition or blending
Remineralization cartridges and blending systems intentionally increase product-water mineral content. Measuring downstream of these components makes the calculated percentage unsuitable for judging the membrane alone.
Low feed pressure
RO membranes rely on pressure to move water through the membrane while rejecting dissolved salts. Pressure below the membrane or system’s specified operating range can reduce performance. Pressure should be checked using approved procedures and suitable equipment rather than by altering safety controls.
Cold feed water
Cold water moves through an RO membrane more slowly. Temperature generally has a stronger effect on production rate than on rejection, but it can contribute to seasonal performance changes and complicate comparisons made months apart.
Fouling or scale
Sediment, hardness scale, metals, and other deposits can affect membrane performance. Pretreatment requirements depend on the source water. Replacing sediment and carbon prefilters on schedule helps protect the membrane, but those filters do not usually reduce ordinary dissolved salts enough to produce the RO rejection percentage.
Oxidant exposure
Many residential thin-film composite membranes can be damaged by ongoing exposure to chlorine or other oxidants. Carbon pretreatment is commonly used where disinfectant is present. The appropriate maintenance schedule depends on water quality, usage, and the system design.
A damaged seal or internal bypass
An incorrectly seated membrane, damaged O-ring, cracked component, or internal bypass can allow feed water to mix with permeate. Inspection should follow the manufacturer’s shutdown and depressurization instructions. A plumbing or water-treatment professional may be appropriate if the source of bypass is unclear.
Normal membrane aging
Membranes gradually lose performance as they age. RO membrane lifespan is not determined by time alone; feed-water quality, pretreatment, operating pressure, water use, and maintenance all matter. A sustained rejection decline after measurement and operating issues have been ruled out is a stronger replacement signal than membrane age by itself.
How to Get a More Reliable Performance Trend
- Use the same meter and sampling points each time.
- Test under similar operating conditions, including similar feed-water temperature.
- Avoid comparing a first-draw sample after a long idle period with a sample from continuous production.
- Record feed TDS, product TDS, calculated rejection, date, and any maintenance performed.
- Repeat an unexpected test before changing filters or replacing the membrane.
- Compare readings with the membrane specification rather than a generic percentage alone.
For a storage-tank system, faucet TDS may vary as the tank fills and empties because changing tank backpressure affects the membrane’s net operating pressure. Consistent test timing makes the long-term trend easier to interpret.
What a TDS-Based Rejection Rate Cannot Confirm
A TDS meter responds mainly to dissolved ions that conduct electricity. It does not identify which ions are present, and it does not reliably measure many uncharged organic chemicals, microorganisms, or individual contaminants at health-relevant concentrations.
A high rejection percentage therefore does not prove that water is free of a specific contaminant or safe for every use. What reverse osmosis removes should be evaluated through applicable third-party certification information or targeted water testing, not inferred from TDS alone.
Likewise, low product-water TDS is not an absolute measure of purity. It is best treated as an inexpensive operational indicator for comparing feed and permeate water and monitoring changes in the RO membrane over time.
Related guides: NSF/ANSI 58 for RO systems • TDS meter reading log template • When to replace an RO membrane
Practical Reading of the Percentage
Calculate rejection with matched feed and permeate samples, then compare the result with the membrane’s specification and the system’s established baseline. If a low result repeats, check sampling location, meter consistency, pressure, temperature, pretreatment maintenance, and possible bypass before deciding that the membrane needs replacement.
Frequently asked questions
How do you calculate RO membrane rejection rate?
Subtract product-water TDS from feed-water TDS, divide by feed-water TDS, and multiply by 100. For example, feed water at 300 ppm and product water at 12 ppm gives a rejection rate of 96%.
What is a good RO membrane rejection rate?
The appropriate benchmark is the membrane’s own rated rejection under its specified test conditions. Many residential membranes have nominal ratings in the upper 90% range, but installed performance can vary with pressure, temperature, and feed-water conditions.
Why is my RO rejection rate lower than expected?
Common causes include sampling after remineralization, inconsistent meter readings, low pressure, membrane fouling, oxidant damage, an internal bypass, or normal membrane aging. Repeat the test with matched samples before replacing parts.
Can I test RO rejection rate from the faucet?
A faucet reading may be useful for tracking overall output, but it may not measure membrane performance alone if the water passes through a tank, post-filter, remineralization cartridge, or blending stage. Test permeate before mineral addition when possible.
Does a high RO rejection rate prove the water is safe?
No. A TDS-based rejection calculation does not identify individual contaminants and does not reliably measure many uncharged chemicals or microorganisms. Use applicable certification information or targeted testing for specific contaminants.
- NSF/ANSI standards explained (42/53/401/58)
- Clear trade-offs: pitcher vs faucet vs under-sink vs RO
- Maintenance planning: cost per gallon and replacement cadence