
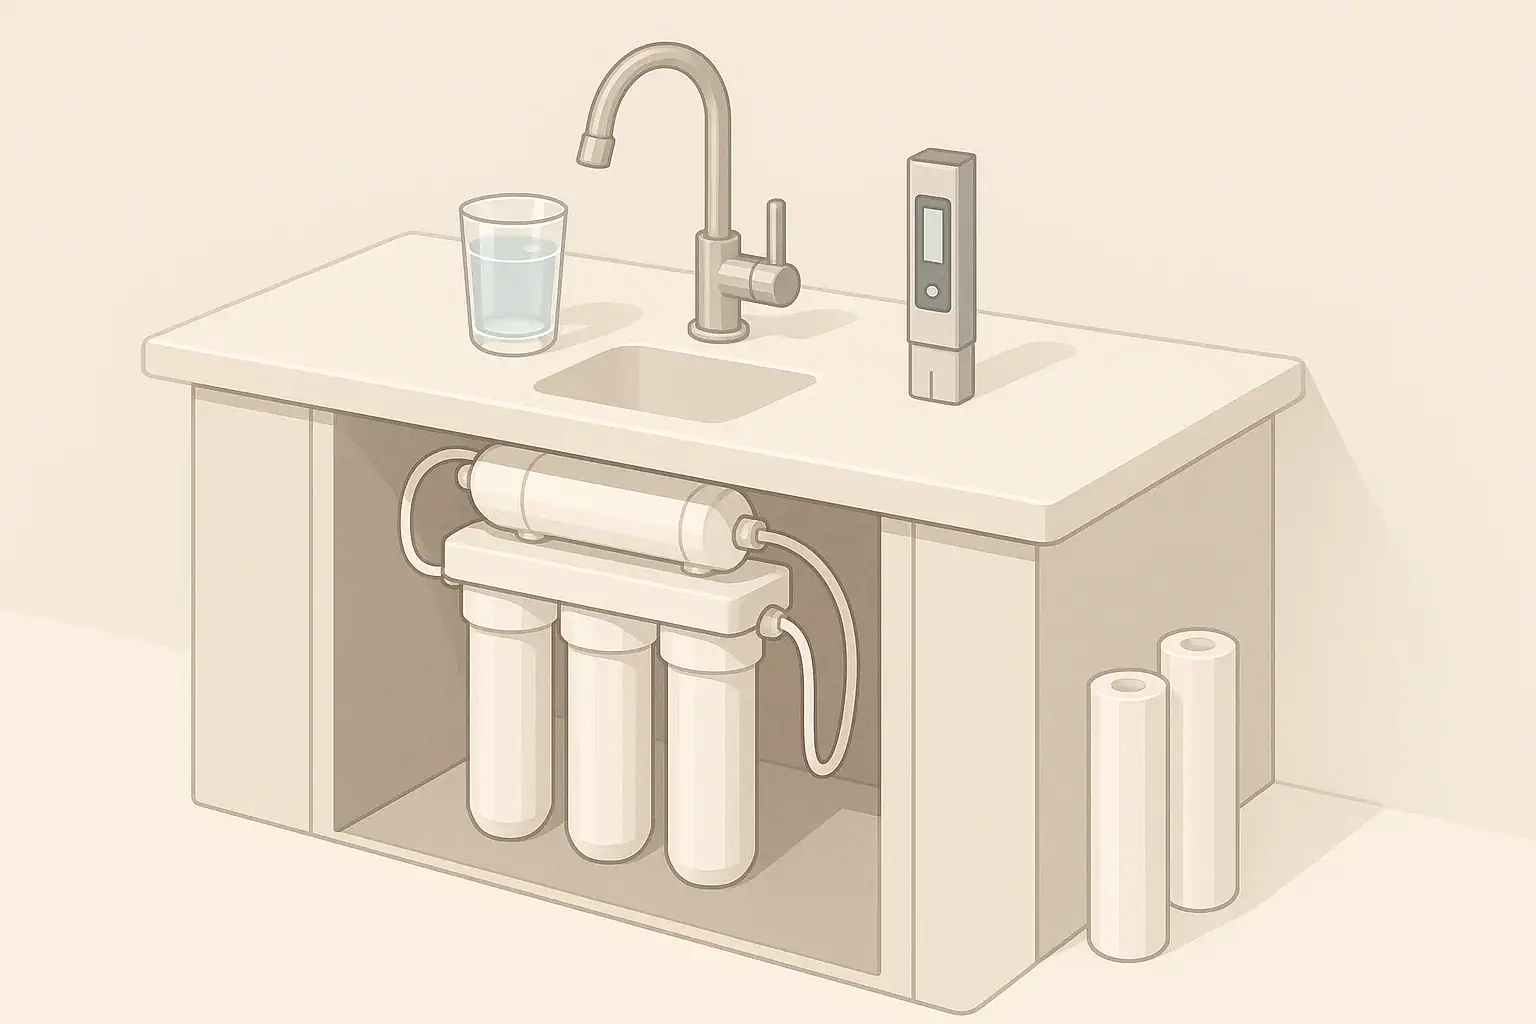
Why Keep a TDS Meter Reading Log?
A TDS meter is a simple tool that estimates total dissolved solids in water by measuring electrical conductivity. For many households, the most useful part is not a single reading. It is the pattern over time.
A TDS meter reading log template helps you record readings consistently, compare them to prior results, and decide when a change deserves attention. This is especially helpful for reverse osmosis systems, where TDS reduction is one practical indicator of membrane performance.
A log can help you:
- Track incoming tap water changes by season or source conditions.
- Watch filtered water readings after cartridge or membrane changes.
- Notice gradual TDS increases that may point to aging RO membrane performance.
- Avoid overreacting to one unusual number caused by testing method, temperature, or stale water in the line.
- Keep maintenance notes in one place for future comparison.
For home use, the goal is not laboratory-grade analysis. The goal is a practical record that supports better maintenance decisions.
What TDS Readings Can and Cannot Tell You
TDS stands for total dissolved solids. It includes dissolved minerals and salts that conduct electricity, such as calcium, magnesium, sodium, chloride, bicarbonate, and similar ions. A TDS meter reports an estimated value, usually in parts per million, based on conductivity.
That makes a TDS meter useful for tracking certain trends, but it does not identify what the dissolved solids are. It also does not directly test for every contaminant people may care about, such as many organic chemicals, microbes, lead particles, PFAS, chlorine, or chloramine. Some of those may require certified lab testing or specific test methods.
It is also important to know how different filtration methods affect TDS:
- Reverse osmosis usually reduces TDS substantially because the membrane removes many dissolved ions.
- Carbon filters may improve taste and reduce certain chemicals, but they usually do not lower TDS much.
- Sediment filters capture particles but generally do not reduce dissolved solids.
- Water softeners exchange hardness minerals for sodium or potassium, so TDS may stay similar or even change slightly without indicating failure.
- Remineralization stages after RO may intentionally raise the final TDS reading.
Because of these limits, a TDS log should be used as one practical maintenance tool, not as a complete water safety evaluation.
Example values for illustration.
| Pattern | What it may mean | Practical response |
|---|---|---|
| Stable tap and stable filtered readings | System conditions appear consistent | Keep logging on the same schedule |
| Tap TDS changes, filtered TDS changes proportionally | Incoming water may have shifted | Compare percentage reduction, not only final number |
| Filtered RO TDS slowly rises over months | Membrane performance may be declining | Check trend, maintenance history, and rejection rate |
| Filtered TDS jumps suddenly | Possible testing error, stale water, bypass, or system issue | Retest after flushing according to normal use |
| Carbon-filtered water TDS stays similar to tap | Typical for many carbon filters | Do not judge carbon filter performance by TDS alone |
| RO water TDS rises after remineralization | Minerals may be added after treatment | Test before and after the remineralization stage if accessible |
| Well water TDS changes after heavy rain or drought | Source conditions may be changing | Consider broader testing if changes are large or persistent |
TDS Meter Reading Log Template
A useful log does not need to be complicated. The best template is one you can repeat the same way each time. Consistency matters more than adding too many details.
You can copy the following fields into a spreadsheet, notebook, or home maintenance app.
Core fields to include
- Date and time: Record when the sample was taken.
- Sample location: Examples include kitchen tap, refrigerator dispenser, RO faucet, bathroom tap, or well pressure tank sample point.
- Water type: Tap, filtered, RO permeate, RO tank water, remineralized water, or softened water.
- TDS reading: Enter the meter result exactly as displayed.
- Temperature if available: Some meters compensate automatically, but noting temperature can still help explain unusual results.
- System status: New filter, normal use, after vacation, after filter change, after sanitizing, or after plumbing work.
- Flush time: Note whether the faucet ran briefly or long enough to clear standing water.
- Notes: Taste changes, pressure drop, cloudy appearance from air bubbles, leak checks, or other observations.
Optional fields for reverse osmosis systems
For RO systems, add two useful columns: incoming TDS and RO water TDS. These allow you to estimate the reduction percentage.
A common calculation is:
Percent reduction = ((Incoming TDS – RO TDS) ÷ Incoming TDS) × 100
For example, if incoming water is 300 ppm and RO water is 30 ppm, the illustrative reduction is 90 percent. This does not prove the system is removing every contaminant, but it can help show whether dissolved solids reduction is changing over time.
Simple log format
Use one row per test. A simple entry might look like this in plain text:
- Date: first day of the month
- Location: kitchen RO faucet
- Incoming TDS: 280 ppm
- RO TDS: 18 ppm
- Estimated reduction: about 94 percent
- System status: normal use
- Notes: no taste change, normal flow
Keep the same format each time so the trend is easy to scan.
How to Take Consistent TDS Measurements
Many confusing TDS trends come from inconsistent sampling. Before interpreting a number, make sure the test method is repeatable.
Use the same sample points
Do not compare a bathroom tap reading to a kitchen filtered faucet reading unless the log clearly identifies the difference. If you are tracking an RO system, it is useful to measure both incoming water and RO water from the same general period.
Let stagnant water clear
Water that has been sitting in tubing, a faucet, or an RO tank may read differently from water produced during normal use. For routine logging, use the same flush practice each time. If your system manual gives a normal flushing recommendation after service or long non-use, follow that guidance.
Rinse the meter probe
Residue on the probe can affect readings. Rinse the probe with clean water after use and follow the meter’s instructions for storage and calibration. Avoid touching the metal probes with your fingers.
Keep containers clean
A cup with detergent residue, mineral deposits, or previous beverage residue can change the result. Use a clean glass or cup each time.
Repeat unusual readings
If a reading is very different from the prior trend, test again before drawing conclusions. A second sample from the same location, taken with the same method, can help separate a real change from a testing artifact.
How to Interpret TDS Trends
Interpreting a TDS log is about patterns, not perfection. Household water readings naturally move within a range. Municipal water sources can change blends. Wells can be affected by season and groundwater conditions. Filters age gradually. RO tanks cycle between full and partially depleted.
Stable readings
If tap water and filtered water readings stay within a fairly consistent range, that usually means conditions are steady. Continue logging at the same interval. For many homes, monthly recording is enough for a general trend, with extra entries after maintenance or unusual events.
Gradual increase in RO water TDS
A slow increase in RO product water over several months can suggest that the membrane is allowing more dissolved solids through. This is more meaningful if the incoming TDS is stable or if the percent reduction is declining.
Before assuming the membrane is the only issue, check practical factors:
- Was the sample taken after the system sat unused?
- Was the storage tank recently depleted?
- Were prefilters changed on schedule?
- Was the reading taken before or after a remineralization stage?
- Has feed water pressure changed noticeably?
Sudden jump in filtered water TDS
A sudden jump deserves a calm retest. Possible explanations include a sampling error, meter contamination, a partially mixed sample, a system bypass issue, a tank-related effect, or a recent filter or plumbing change. If the elevated reading repeats under the same conditions, review the system manual and maintenance history.
Tap water changes
Tap water TDS may move because of seasonal source changes, drought conditions, road salt influence in some areas, blending of water sources, or well conditions. If both tap and filtered readings move together, the filter may be responding to a changed feed water rather than failing.
Carbon filter readings
Do not use TDS as the main performance test for standard carbon filters. A carbon filter can improve taste and reduce certain substances while leaving dissolved mineral content nearly unchanged. A stable TDS reading before and after a carbon filter is not, by itself, evidence that the filter is not doing anything.
When TDS Trends Suggest Maintenance
A TDS log is most useful when paired with normal maintenance records. Cartridge age, water use, pressure changes, and taste observations can help explain the numbers.
For RO systems, rising TDS may relate to membrane condition, but prefilters matter too. Sediment and carbon prefilters help protect downstream components. If they are overdue, the system may experience pressure drop or reduced protection for the membrane. Do not bypass cartridges or disable safety features to improve flow or change readings.
For refrigerator filters, faucet filters, pitchers, and carbon-based systems, replacement timing is usually based on rated capacity, time in service, flow reduction, taste and odor changes, and manufacturer instructions rather than TDS reduction.
For well water, a TDS trend can be a prompt to look more closely, but it should not replace appropriate well testing. If a well shows persistent, unexplained changes in TDS along with changes in taste, odor, color, or sediment, broader water testing may be appropriate.
Example values for illustration.
| System or part | Log clue | Maintenance consideration |
|---|---|---|
| RO membrane | RO TDS rises gradually while feed TDS is similar | Calculate reduction trend and review membrane age |
| RO prefilters | Flow slows or pressure seems reduced | Check cartridge schedule and pressure requirements |
| RO postfilter | Taste changes but TDS is similar | Review postfilter age and normal replacement interval |
| Remineralization cartridge | Final TDS is higher than RO-only sample | Confirm whether added minerals are expected |
| Carbon faucet filter | TDS does not change much | Use capacity, time, taste, and flow for replacement planning |
| Sediment filter | TDS is unchanged but flow drops | Inspect for particle loading or overdue replacement |
| Well water system | Source TDS shifts persistently | Consider broader water testing and system review |
Practical Notes for Using the Log Over Time
Keep your TDS log simple enough that you will actually use it. A monthly entry is often more valuable than a detailed template that gets abandoned after two weeks. Add extra entries after filter changes, membrane replacement, system sanitizing, long vacations, or noticeable changes in taste, odor, flow, or appearance.
It also helps to mark maintenance events directly in the log. For example, note when sediment and carbon cartridges were changed, when an RO membrane was replaced, or when a remineralization cartridge was installed. These notes make later readings much easier to interpret.
If you use more than one treatment device, keep the locations separate. A pitcher, an under-sink RO faucet, a refrigerator dispenser, and an unfiltered kitchen tap may all show different readings for normal reasons.
Finally, remember that TDS is a screening and trend tool. It is useful for monitoring dissolved solids patterns, especially around RO performance, but it is not a complete water quality report. For specific concerns, use the appropriate test method and review results in context with your water source, plumbing, and filtration setup.
Frequently asked questions
How often should I record TDS readings?
For most homes, monthly readings are a good starting point. Add extra entries after filter changes, maintenance, vacations, or any noticeable change in taste, flow, or water appearance.
What is a good TDS reading for RO water?
There is no single perfect number, but RO water is usually much lower than the incoming tap water. A better way to judge performance is to track the percent reduction over time.
Why did my TDS reading change after a filter replacement?
A new filter, a flushed system, or a different sample point can all affect the result. Recheck using the same method and compare the reading to your earlier trend.
Can a TDS meter tell me if water is safe to drink?
No. A TDS meter only estimates dissolved solids. It does not identify specific contaminants or confirm that water is safe on its own.
Why does my carbon filter not lower TDS much?
Many carbon filters improve taste and reduce certain chemicals without removing much dissolved mineral content. That is normal, so TDS alone is not a good carbon filter performance test.
Related guides: Reverse Osmosis 101: What RO Removes (and What It Doesn’t) • What NSF/ANSI 58 Covers for RO Systems (and What It Doesn’t) • Remineralization Filters: Do You Need One with RO Water? • RO Filter Replacement Schedule: Prefilters vs Membrane • When to Replace an RO Membrane: Signs & Simple Checks
Recommended next:
- Cost per Gallon Calculator: How to Compare Filters Fairly
- Replacement Planner Tool: Estimate Your Next Filter Change Date
- Flow Rate Calculator: Estimate GPM for Your Kitchen Faucet
- Filter Selector Quiz: Find the Right Filter Type in 2 Minutes
- Cost per Gallon Walkthrough: Pitcher vs Under-Sink Example
- Filter Capacity Calculator: Convert Daily Use into Months
- More in Tools & Calculators →
- NSF/ANSI standards explained (42/53/401/58)
- Clear trade-offs: pitcher vs faucet vs under-sink vs RO
- Maintenance planning: cost per gallon and replacement cadence